Income In-Equality and Progressive Taxes

With unemployment rates at a record low level, some have shifted focus to income in-equality, and subsequent tax increases. This caused us to review how income distribution in America has changed and how it compares with inequality measures of other nations.
Italian statistician, Corrado Gini, created the Gini coefficient in 1912 to measure the inequality among values of frequency distributions. If all values are the same, the Gini coefficient would be zero. Conversely, if only one number was high in the distribution and all the remainder zero, the Gini coefficient would be 100. (The Investopedia article on the subject can provide further explanation.) This calculation is now widely applied to income and is often used to compare one country’s inequality to others.
The Organization for Economic Co-operation and Development (OECD), is an international group that gathers data from around the world including these Gini numbers.

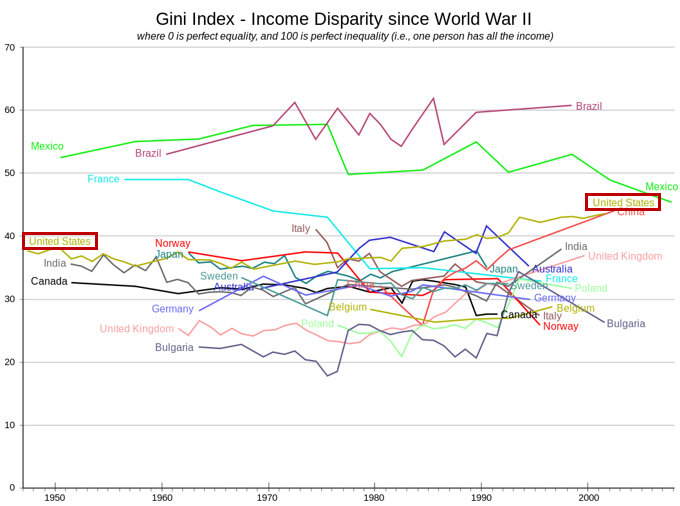
As you can see in Wikipedia’s chart, the USA’s Gini coefficient has risen from the high 30s in 1950 to the mid-’40s more recently. America does, however, lead in education, with a Gini index of only 14—showing we had the lowest education inequality. Brazil, at 61, has one of the highest coefficients and is, therefore, more unequal in its income distribution. European countries tend to have flat-lined over this period, falling in the low 30’s. Interestingly, China’s Gini has been moving up to equal or perhaps exceed the Gini coefficient of the United States.
The rising trend in China, India and the United States may indicate that faster-growing economies see increases in inequality. One explanation may be that new businesses, such as Facebook, Google, and many others, have created thousands of new millionaires among their long-term employees. Other possible causes may relate to societal changes in the U.S., such as the increase in single-parent households. In 1960, only 9% of children lived in single-parent households, but that percentage has risen to 26% in 2014. The shift of manufacturing jobs towards higher-skilled people has also played a role, as lower-skilled jobs either move offshore or become automated. Immigration (both legal and undocumented) of lower-skilled workers can drive down average wages.
The OECD finds that countries with more income concentrated in top percentages also tend to have more progressive tax systems. As recently as 2008, the OECD declared that the United States had the most progressive tax system of all. One of OECD’s recommendations on making tax systems fairer, without raising tax rates, was to eliminate deductions that benefit the rich. This was done in the recent tax changes by limiting the State and Local Tax (SALT) deduction—however, closing this loophole has become rather unpopular in high-tax states, like New York.
The United States’ income tax is progressive, but most households pay more in payroll taxes than they do in taxes on income. The Social Security system can be considered mildly progressive when taking into consideration the benefits received versus the amount of taxes paid into the system. Medicare is very progressive, as its taxes on wages are uncapped, high-income earners pay an unequal tax on investment income, and pay significantly higher monthly premiums to Medicare.
Despite progressive taxes, there are not enough wealthy citizens to fully balance our budget. Bill Gates, the wealthiest man in America, with an estimated net worth of $108 billion, could only cover our Federal deficit for 38 days. Perhaps the most fitting solution to income inequality is a strong job market that provides people at all income levels more opportunities to advance.
